8 - Get Insights Into Your Operation
SureView Ops tracks every action taken by an operator during an event. This real-time, date-stamped, audit trail, provides the backbone for all the metrics available in our reporting interface: we it call Insights.

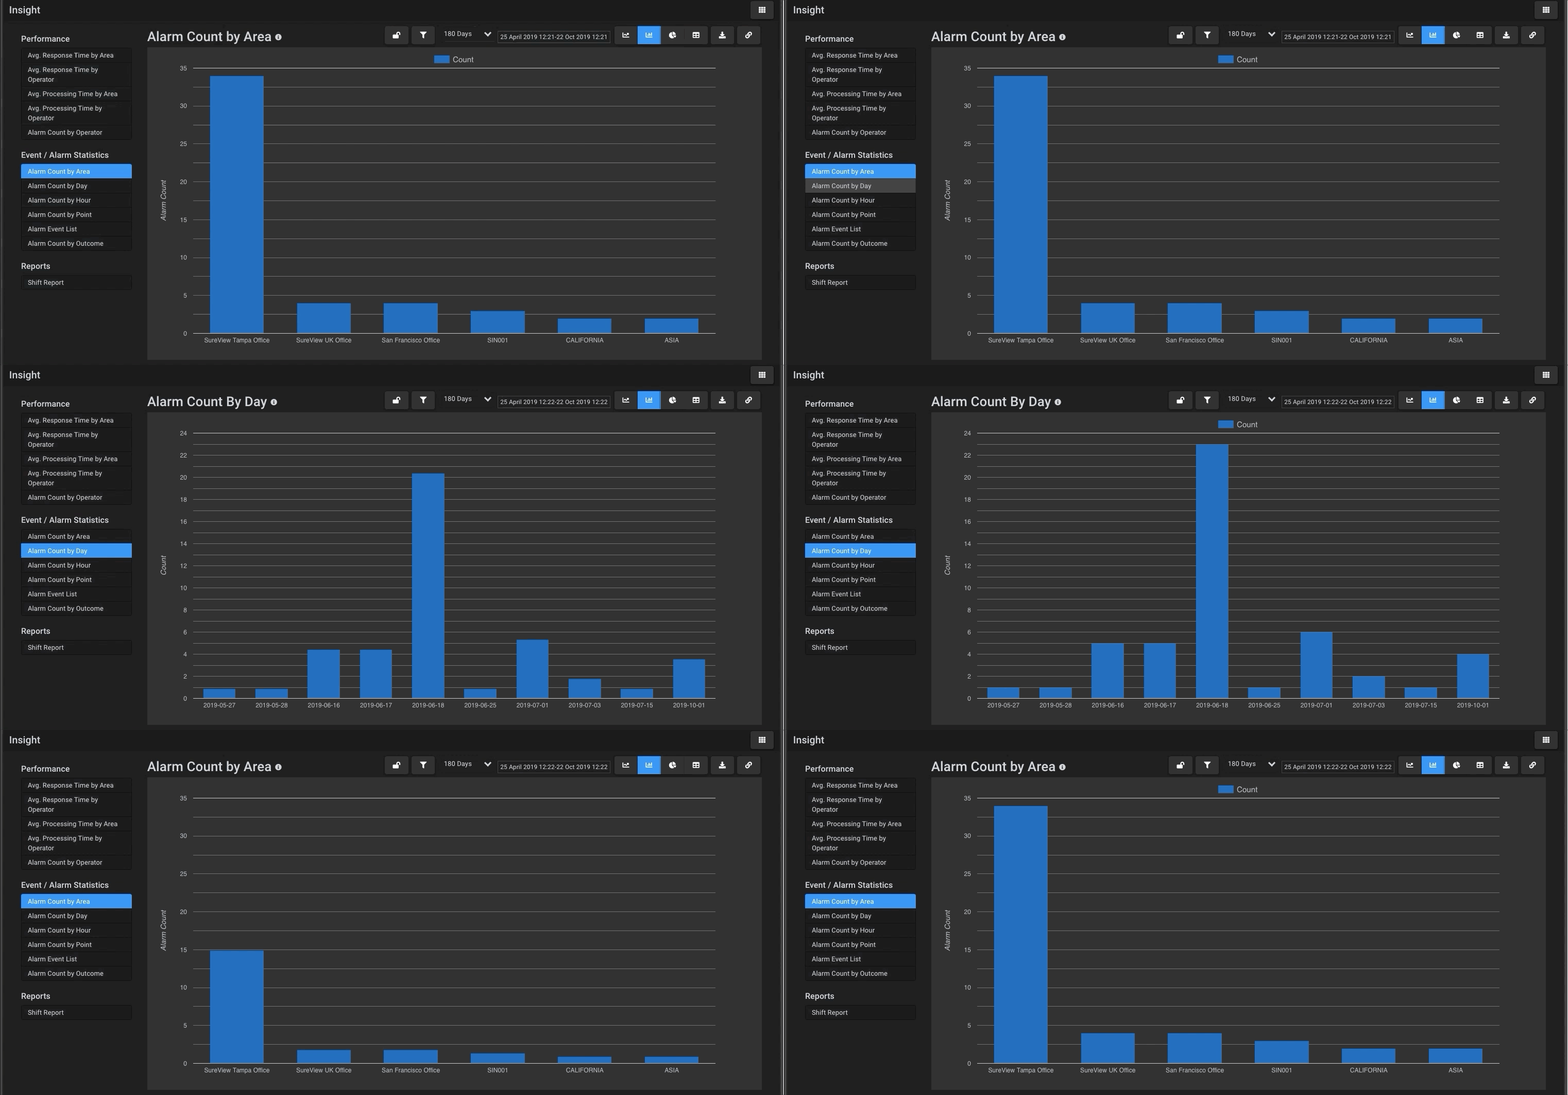
The Insights interface provides an interactive way to analyze the key performance metrics of your team. It’s really easy to use, just select the metric you want to review from the menu on the left side. The system will graph the data. Then, click on any of the data points on the graph to drill into that specific point for more detail.
The menu at the top of the interface allows you to change the reporting period of the current view, filter the data even further, and view the data in different ways (bar graphs, pie charts, line graphs). You can even download the raw data and manipulate it further in your preferred spreadsheet or reporting program.
With a focus on response times and event statistics, Insights easily identifies areas of your operation that can be improved.
For more detail please see the Insights Help Page.
Comments
0 commentsPlease sign in to leave a comment.